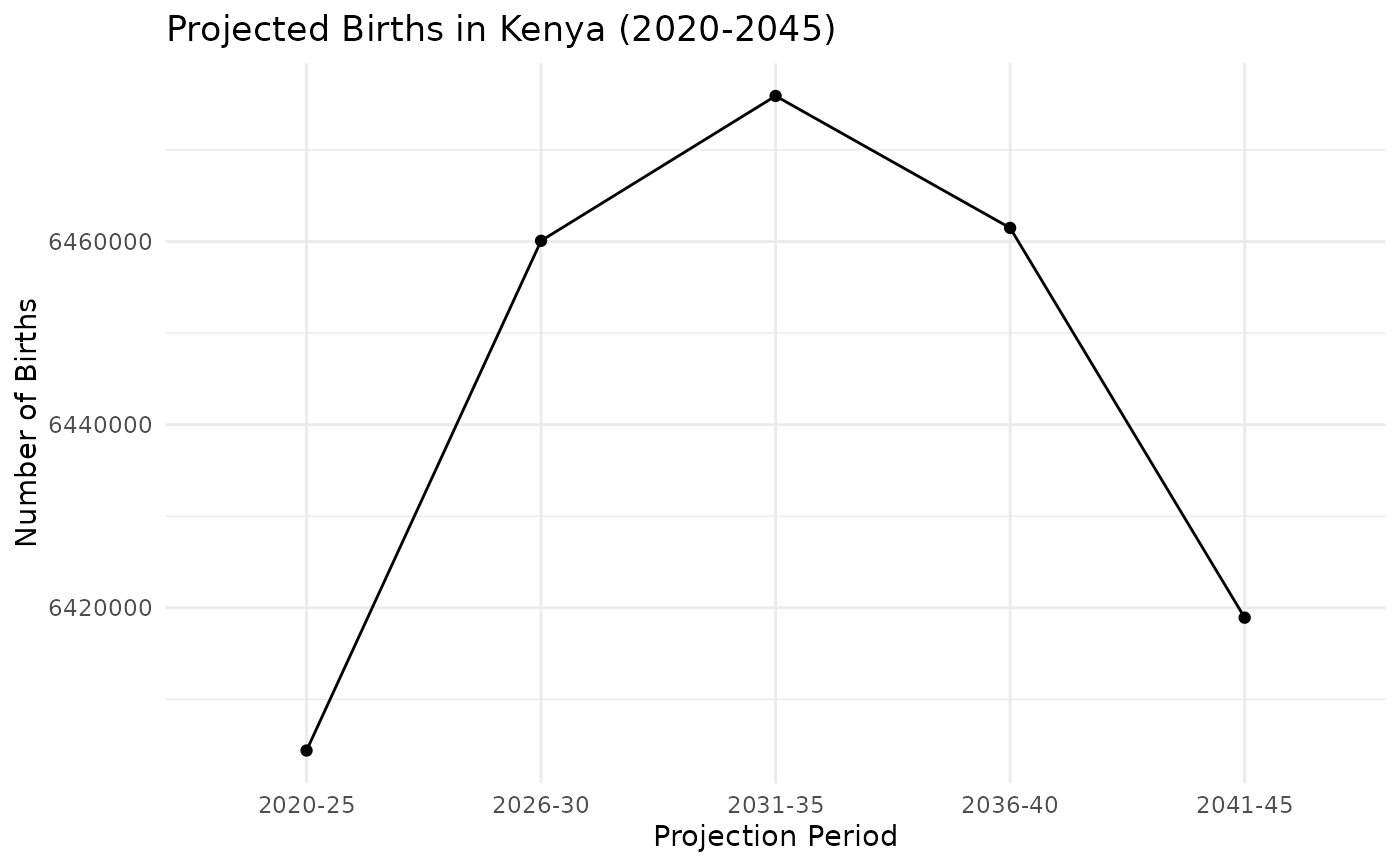
This dataset provides components of population change in Kenya over several 5-year projection periods from 2020 to 2045. The dataset includes key demographic components such as births, deaths, natural increase, and migration, along with related population rates such as crude birth rate, crude death rate, natural increase rate, and net migration rate. The data is structured for each projection period.
Format
A data frame with 1,920 rows and 4 variables:
- county
Name of the county (factor).
- component
The demographic component being measured (factor). Possible values include:
- Births
The total number of births during the projection period.
- Deaths
The total number of deaths during the projection period.
- Nat. Inc.
Natural Increase: the difference between births and deaths during the projection period.
- Net Mig.
Net Migration: the net number of people entering or leaving Kenya during the projection period (immigrants minus emigrants).
- CBR
Crude Birth Rate: the number of births per 1,000 population per year during the projection period.
- CDR
Crude Death Rate: the number of deaths per 1,000 population per year during the projection period.
- CNIR
Crude Natural Increase Rate: the difference between the crude birth rate and crude death rate, representing natural population growth per 1,000 population per year.
- CNMR
Crude Net Migration Rate: the net migration rate, representing the net number of migrants per 1,000 population per year.
- year
The 5-year projection period (factor). Possible values are "2020-25", "2026-30", "2031-35", "2036-40", and "2041-45".
- value
The numeric value associated with the component for the specific projection period (numeric).
Source
Kenya National Bureau of Statistics (2023). 2019 Kenya Population and Housing Census Analytical Report on Population Projections. Retrieved from knbs.or.ke.
Details
This dataset captures various components of population change for Kenya from 2020 to 2045. It allows users to analyze demographic changes over time, including the impacts of births, deaths, migration, and natural increase on population size. The rates, such as the crude birth rate (CBR) and crude death rate (CDR), provide insights into demographic trends per 1,000 population.
value is kept at the full decimal precision published by KNBS (these
are cohort-component projections, not rounded figures); round it
yourself if whole-number figures are needed.
Components Explained:
Births: Total births during the projection period.
Deaths: Total deaths during the projection period.
Natural Increase (Nat. Inc.): Difference between births and deaths.
Net Migration (Net Mig.): Net migration (immigrants minus emigrants) during the projection period.
Crude Birth Rate (CBR): Births per 1,000 people per year.
Crude Death Rate (CDR): Deaths per 1,000 people per year.
Crude Natural Increase Rate (CNIR): Natural increase per 1,000 people per year (CBR minus CDR).
Crude Net Migration Rate (CNMR): Net migration per 1,000 people per year.
Examples
data(components)
head(components)
#> # A tibble: 6 × 4
#>   county component year       value
#>   <fct>  <fct>     <fct>      <dbl>
#> 1 Kenya  Births    2020-25 6404408.
#> 2 Kenya  Births    2026-30 6460085.
#> 3 Kenya  Births    2031-35 6475904.
#> 4 Kenya  Births    2036-40 6461490.
#> 5 Kenya  Births    2041-45 6418919.
#> 6 Kenya  Deaths    2020-25 1890966.
summary(components)
#>              county       component        year         value
#>  Baringo        :  40   Births :240   2020-25:384   Min.   : -29286.3
#>  Bomet          :  40   CBR    :240   2026-30:384   1st Qu.:      6.4
#>  Bungoma        :  40   CDR    :240   2031-35:384   Median :     21.4
#>  Busia          :  40   CNIR   :240   2036-40:384   Mean   :  67132.2
#>  Elgeyo-Marakwet:  40   CNMR   :240   2041-45:384   3rd Qu.:  50576.3
#>  Embu           :  40   Deaths :240                 Max.   :6475903.7
#>  (Other)        :1680   (Other):480

# Example: Plot the number of births over the projection periods for Kenya
if (requireNamespace("ggplot2", quietly = TRUE) &&
    requireNamespace("dplyr", quietly = TRUE)) {
  library(ggplot2)
  library(dplyr)
  births <- components %>%
    filter(component == "Births", county == 'Kenya')
  ggplot(births, aes(x = factor(year, ordered = TRUE), y = value, group = county)) +
    geom_line() +
    geom_point() +
    labs(
      title = "Projected Births in Kenya (2020-2045)",
      x = "Projection Period",
      y = "Number of Births"
    ) +
    theme_minimal()
}
#>
#> Attaching package: ‘dplyr’
#> The following objects are masked from ‘package:stats’:
#>
#>     filter, lag
#> The following objects are masked from ‘package:base’:
#>
#>     intersect, setdiff, setequal, union