Base and Projected Age Distributions in Kenya (2020-2045, Five-Year Increments)
Source:R/pop5.R
pop5.RdThis dataset provides base and projected population distributions by county, age group, gender, and year for Kenya from 2020 to 2045 in five-year increments. It includes population estimates derived from the 2019 Kenya Population and Housing Census and subsequent projections by the Kenya National Bureau of Statistics (KNBS).
Format
A data frame with 15,552 rows and 5 variables:
- county
Name of the county in Kenya
- age
Age group in 5-year intervals (e.g., "0-4", "5-9", ..., "80+")
- year
Year of the population estimate
- gender
Gender category ("Male", "Female", or "Total")
- pop
Estimated population for the specified county, age group, gender, and year
Source
Kenya National Bureau of Statistics (2023). 2019 Kenya Population and Housing Census Analytical Report on Population Projections. Retrieved from knbs.or.ke.
Details
The pop5 dataset can be used to analyse demographic trends, plan resource allocation,
and study population dynamics in Kenya over the specified years. The projections
take into account factors such as fertility rates, mortality rates, and migration
patterns. The age groups are provided in 5-year intervals, and the population
estimates are available in five-year increments from 2020 to 2045.
pop is kept at the full decimal precision published by KNBS (these are
cohort-component projections, not rounded head counts); round it yourself
if whole-person figures are needed.
Note:
The "Total" gender category represents the combined population of both males and females.
The "All Ages" age category represents the combined ages of all age groups.
Examples
data(pop5)
head(pop5)
#> # A tibble: 6 × 5
#>   county age    year gender      pop
#>   <fct>  <fct> <int> <fct>     <dbl>
#> 1 Kenya  0-4    2020 Male   3123737
#> 2 Kenya  0-4    2020 Female 3156282
#> 3 Kenya  0-4    2020 Total  6280019
#> 4 Kenya  0-4    2025 Male   3221623.
#> 5 Kenya  0-4    2025 Female 3111637.
#> 6 Kenya  0-4    2025 Total  6333261.
summary(pop5)
#>              county           age             year         gender
#>  Baringo        :  324   0-4    :  864   Min.   :2020   Female:5184
#>  Bomet          :  324   5-9    :  864   1st Qu.:2025   Male  :5184
#>  Bungoma        :  324   10-14  :  864   Median :2032   Total :5184
#>  Busia          :  324   15-19  :  864   Mean   :2032
#>  Elgeyo-Marakwet:  324   20-24  :  864   3rd Qu.:2040
#>  Embu           :  324   25-29  :  864   Max.   :2045
#>  (Other)        :13608   (Other):10368
#>       pop
#>  Min.   :     386
#>  1st Qu.:   12779
#>  Median :   36744
#>  Mean   :  184471
#>  3rd Qu.:   78528
#>  Max.   :70179943
#>

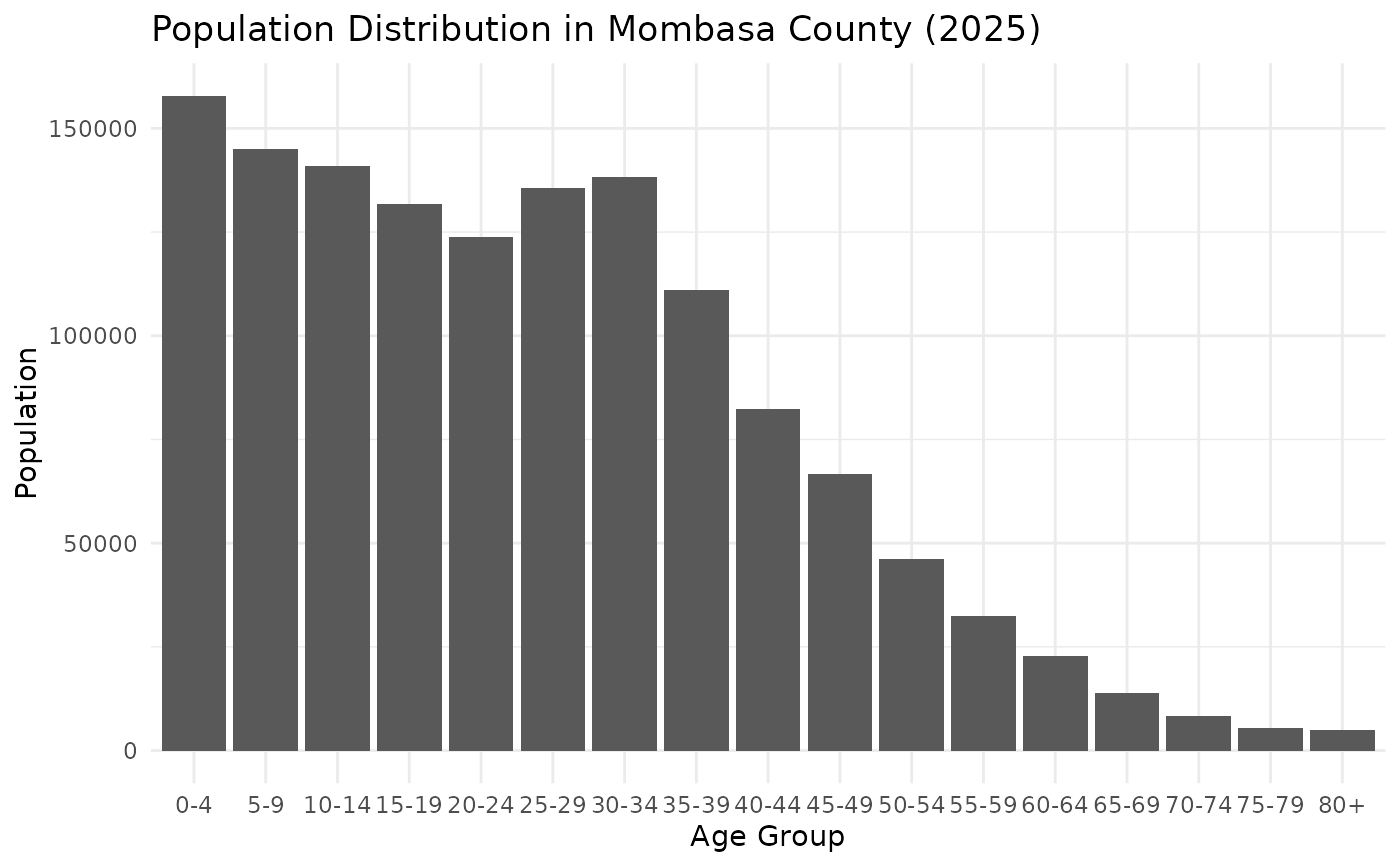
# Example: Plotting the population distribution for Mombasa County in 2025
if (requireNamespace("ggplot2", quietly = TRUE) &&
    requireNamespace("dplyr", quietly = TRUE)) {
  library(ggplot2)
  library(dplyr)
  mombasa_2025 <- pop5 %>%
    filter(county == "Mombasa", year == 2025, gender == "Total", age != 'All Ages')
  ggplot(mombasa_2025, aes(x = age, y = pop)) +
    geom_bar(stat = "identity") +
    labs(
      title = "Population Distribution in Mombasa County (2025)",
      x = "Age Group",
      y = "Population"
    ) +
    theme_minimal()
}